Dashboard
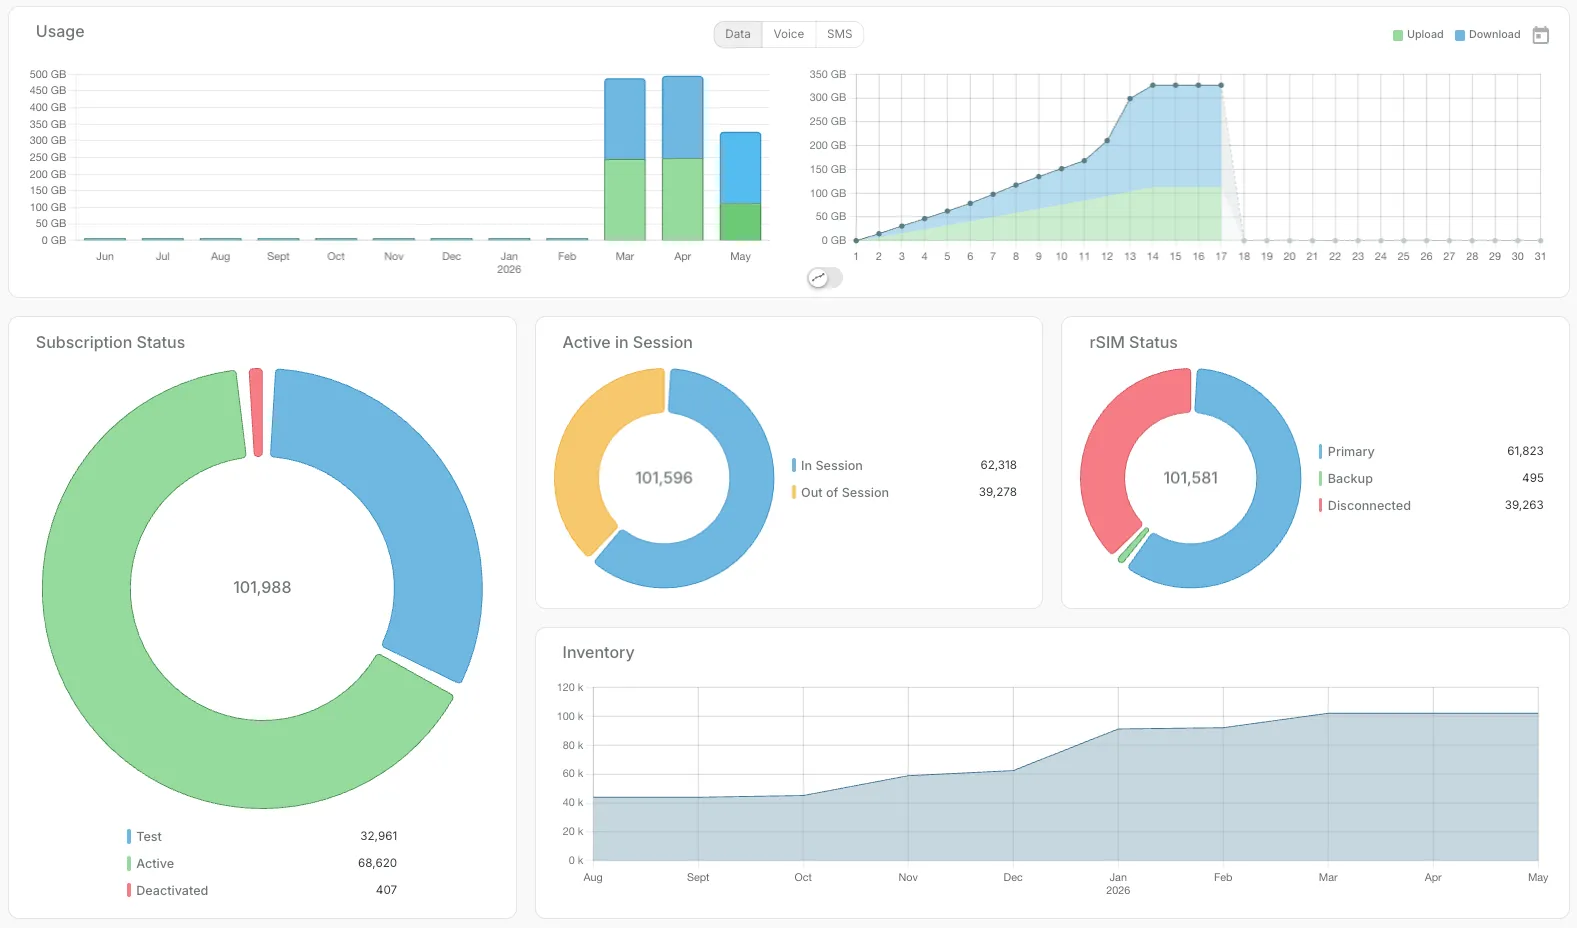
Dashboard is the landing page for IoT.live. This provides a summary view of your fleet. The widgets on this page show the Subscription Status, Active Session Status, rSIM Resilience Status (if applicable), and Inventory Level for the last few months.
Usage
Usage Charts
This widget is located at the top of the Dashboard, comprising of two components:

Historical Usage
The chart on the left of the widget; illustrates usage from previous bill cycles, for up to the prior 12 months. Chart columns display the total usage in cycle, split by data download / upload - or mobile originating (sent) / mobile terminating (received) for Voice and SMS.
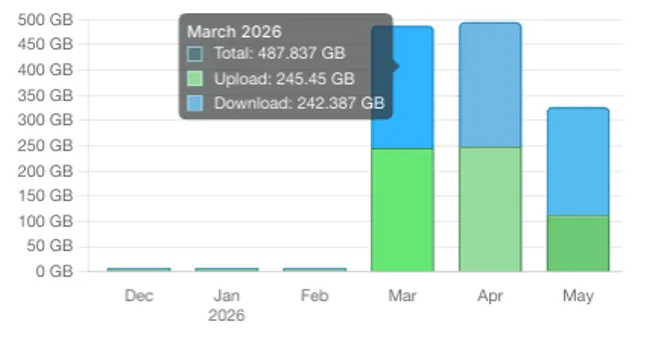
Hovering over chart segments displays a tooltip detailing total and individual values.
In-Cycle Usage
The chart on the right of the widget; illustrates usage from the current bill cycle.
Forecast Usage
Shows an estimated forward projection within the In-Cycle Usage chart - to the end of the month / bill cycle, based on average usage from the beginning of the cycle to date.

Forecast usage is based upon daily averages from the current cycle - it does not account for significant daily deviations, longer-term trends, or mid-cycle fleet changes. Please bear this in mind if you are using this feature to estimate your position at the end of the cycle.
Usage-Type Selector
Allows for switching both charts between alternative traffic usage types - Data, Voice, and SMS.
Selector Toggle
Allows for switching the chart view between cumulative (aggregated total throughout the month / bill cycle), and daily (individual totals used each day) usage.


Calendar
Shown next to the chart legend - when hovered over, displays a tooltip displaying the timestamp of when the usage data shown on this page was last updated.
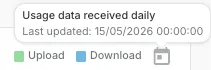
Usage data is not real-time, it's updated daily - if unsure about the recency of the data, please use this function to check when the chart data was last updated.
Subscription Status
The Subscription Status widget provides a summary overview of the status of your fleet states for Test, Active, and Deactivated.
- Test: Total subscriptions in a Test / Test-Ready status.
- Active: Total subscriptions in an Active status.
- Deactivated: Total subscriptions in a Deactivated (Suspended) status.
The chart provides a colour-coded visual breakdown, totals for each status, and the overall total of subscriptions in the centre, supporting operational oversight.
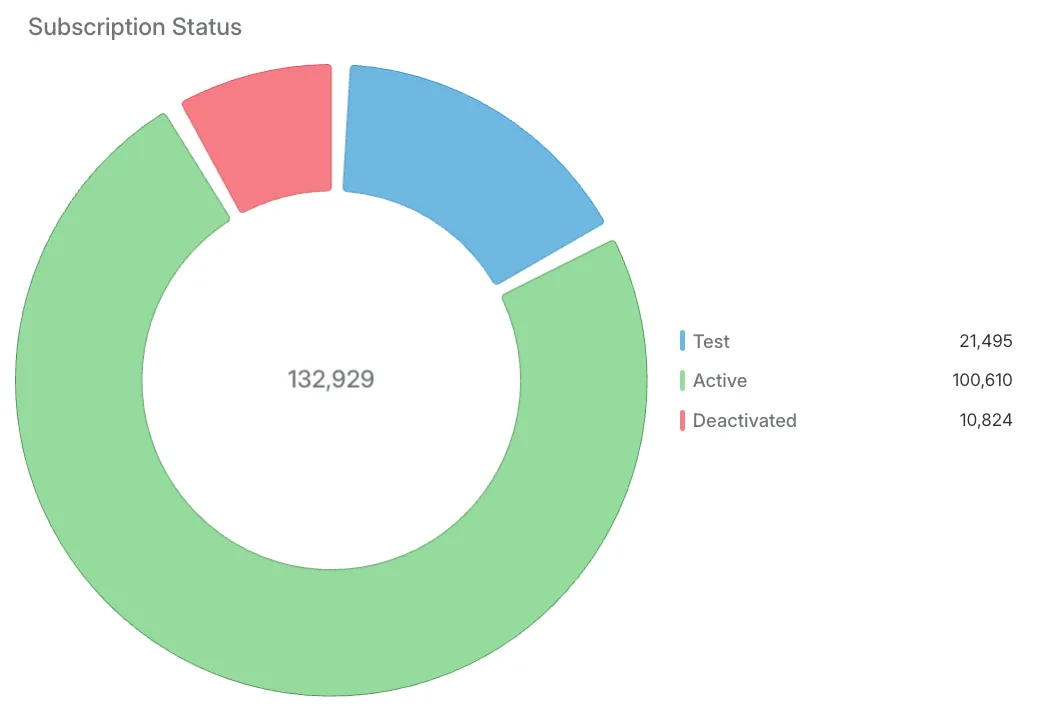
Subscription Status total also includes your Deactivated SIMs - this is why there can be a higher total shown here, than on the Active in Session and rSIM Status widgets.
There may be occasional further differences - where Subscription Status data is updated daily, and Active in Session and rSIM Status widget data is near real-time.
Active in Session
A simple chart shows which SIMs are In Session or Out of Session.
- In Session: The device is actively connected to the mobile network. It has a live data connection open, and is able to send and receive data.
- Out of Session: The device is not currently using data. There is no active connection open to the network, but it can still reconnect when needed.
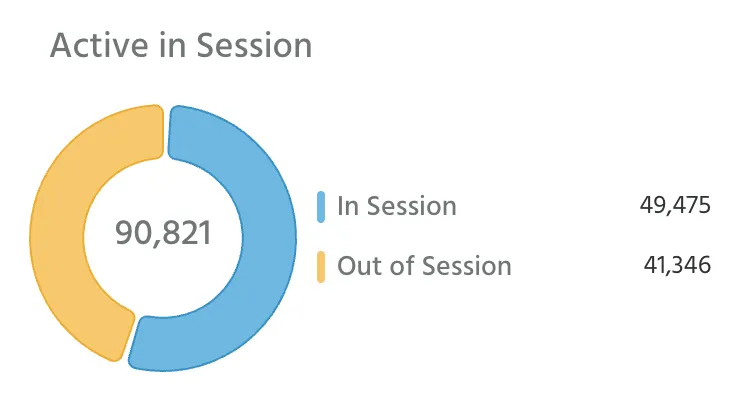
This data is near real-time. For the exact status of an individual asset, please refer to the SIM Details or rSIM Details page.
Inventory
The dashboard Inventory gives you a clear, account-level view of your total SIM / rSIM inventory and volume trend for the last few months.
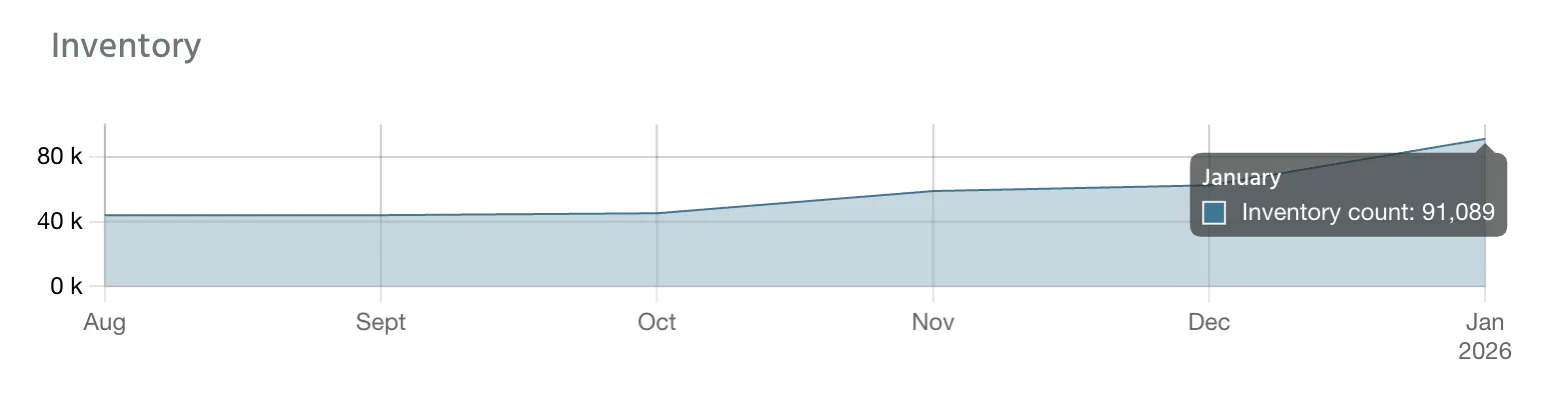
Hovering over a monthly value displays a tooltip with the exact count.
rSIM Status (if applicable)
If your account has rSIM products, the rSIM Status widget will be displayed. For Resilient SIMs, you can see how many are on:
Primary: The rSIM products currently operating via the primary (prefered) profile.
Backup: The rSIM products currently operating via a backup (fallback / secondary) profile.
Disconnected: Neither rSIM profile is in session (the connection is offline).
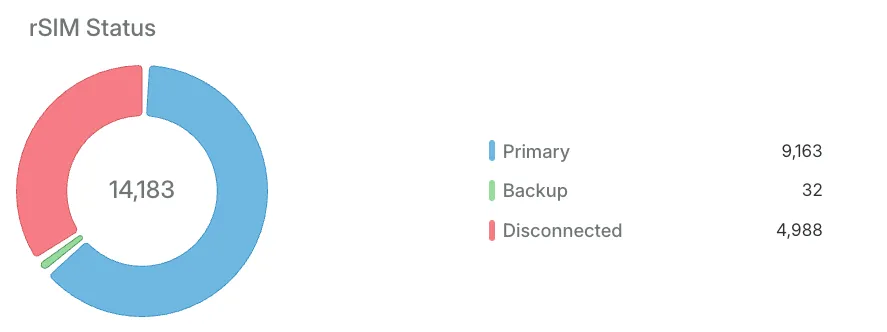
This widget will not appear in the Dashboard if your account does not contain any rSIM products. Please refer to the rSIM Details page for the current status of any individual asset.