Getting Connection Information
10.9. Getting Connection Information
The IoTM Portal offers a substantial amount of information about the connection deployment and the connections’ functionality. The primary functional pages for working with connections are the Inventory Management and the connection ID (single device) Details page. These pages follow the standard navigation model used throughout the Portal.
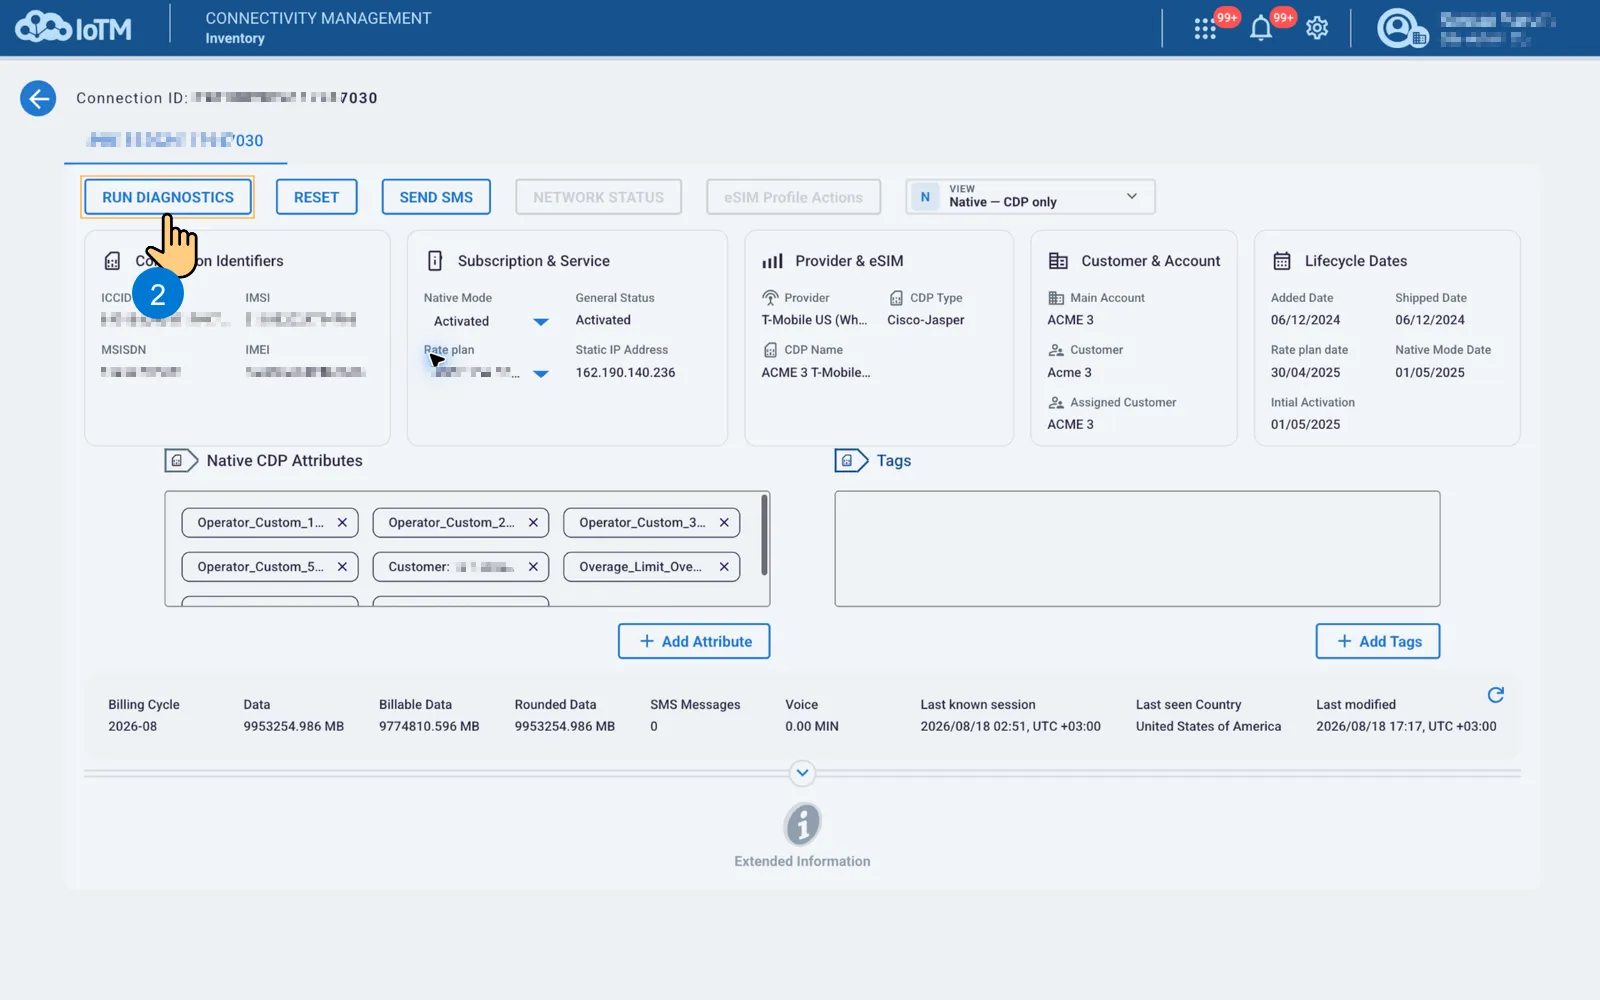
The single device details page provides you with a snapshot view of the basic characteristics of the chosen connection, including its initial activation date, current status, state, and rate plan, as well as historic timestamps of its first shipped and added dates and the dates of the last state or rate plan changes made to it.
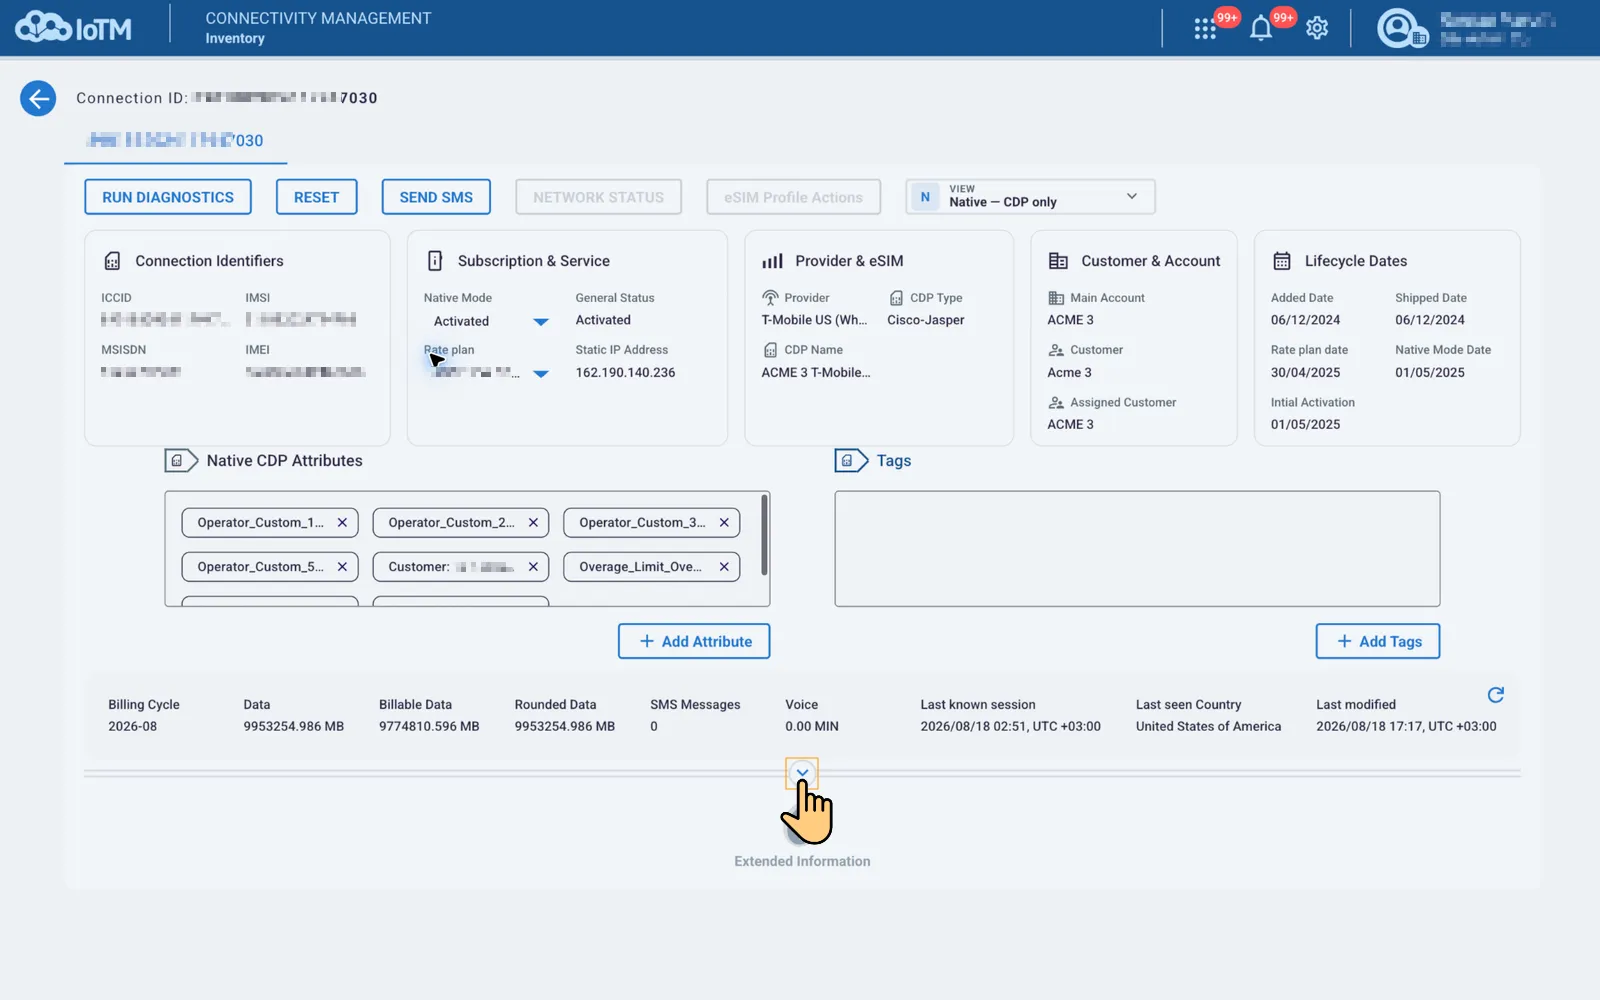
Clicking on the dropdown button at the bottom of the details pane will expand the page and take you to the Connection Usage and Audit Information section, where you can obtain granular historical information about the connection’s lifecycle.
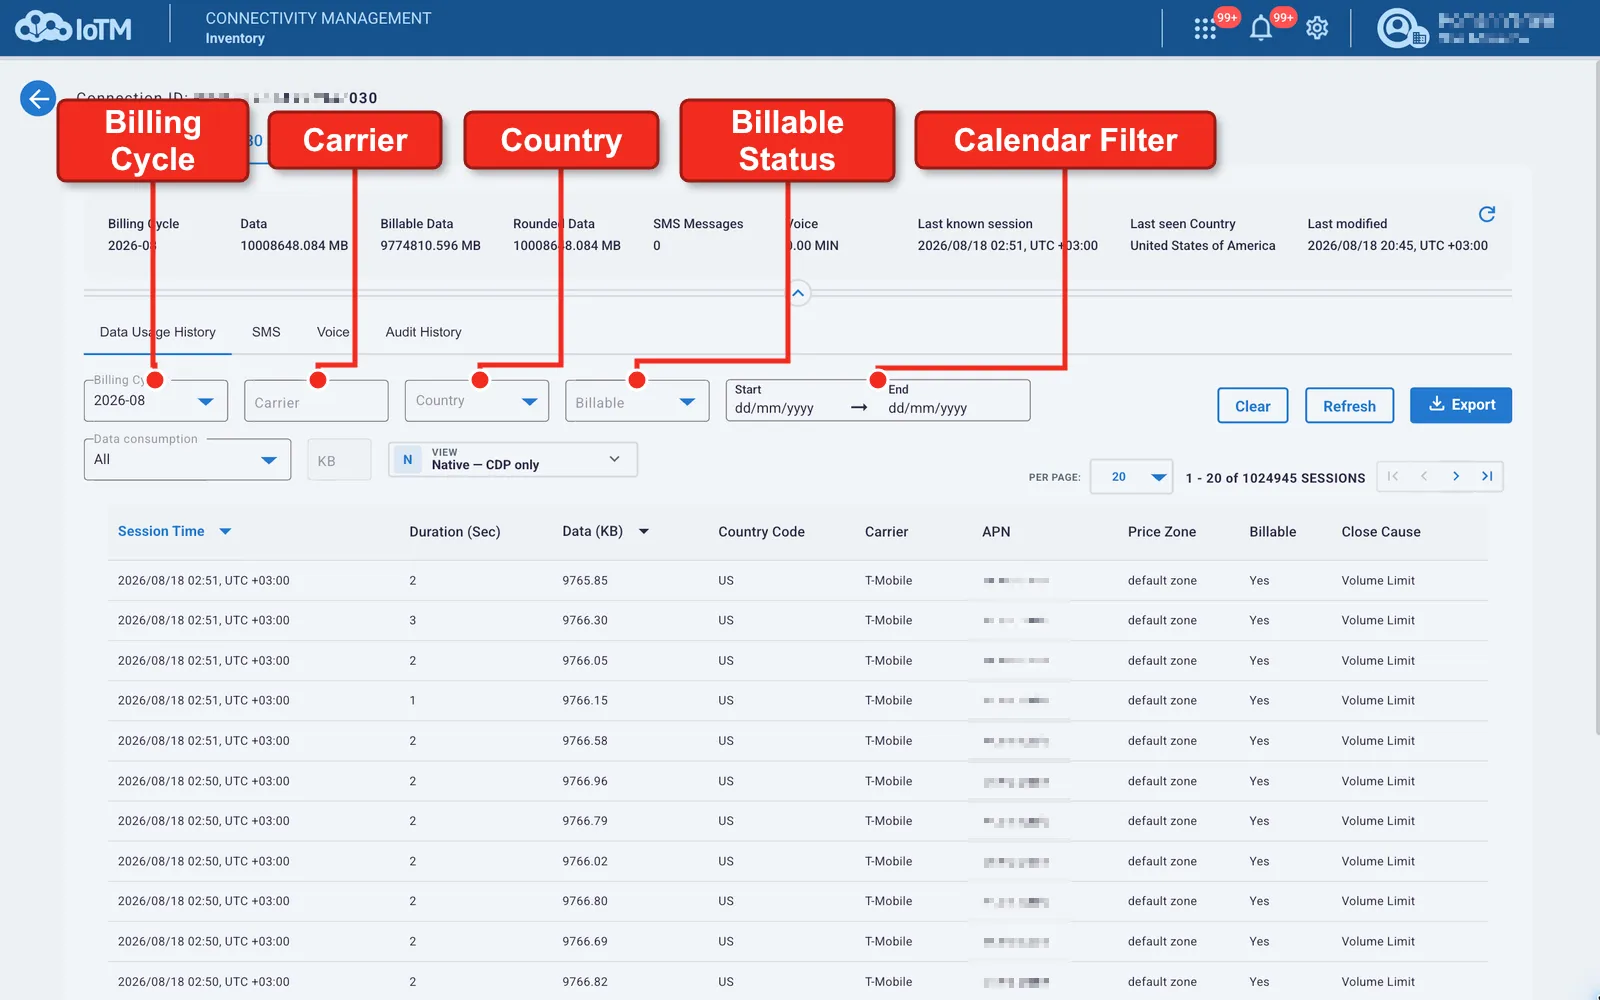
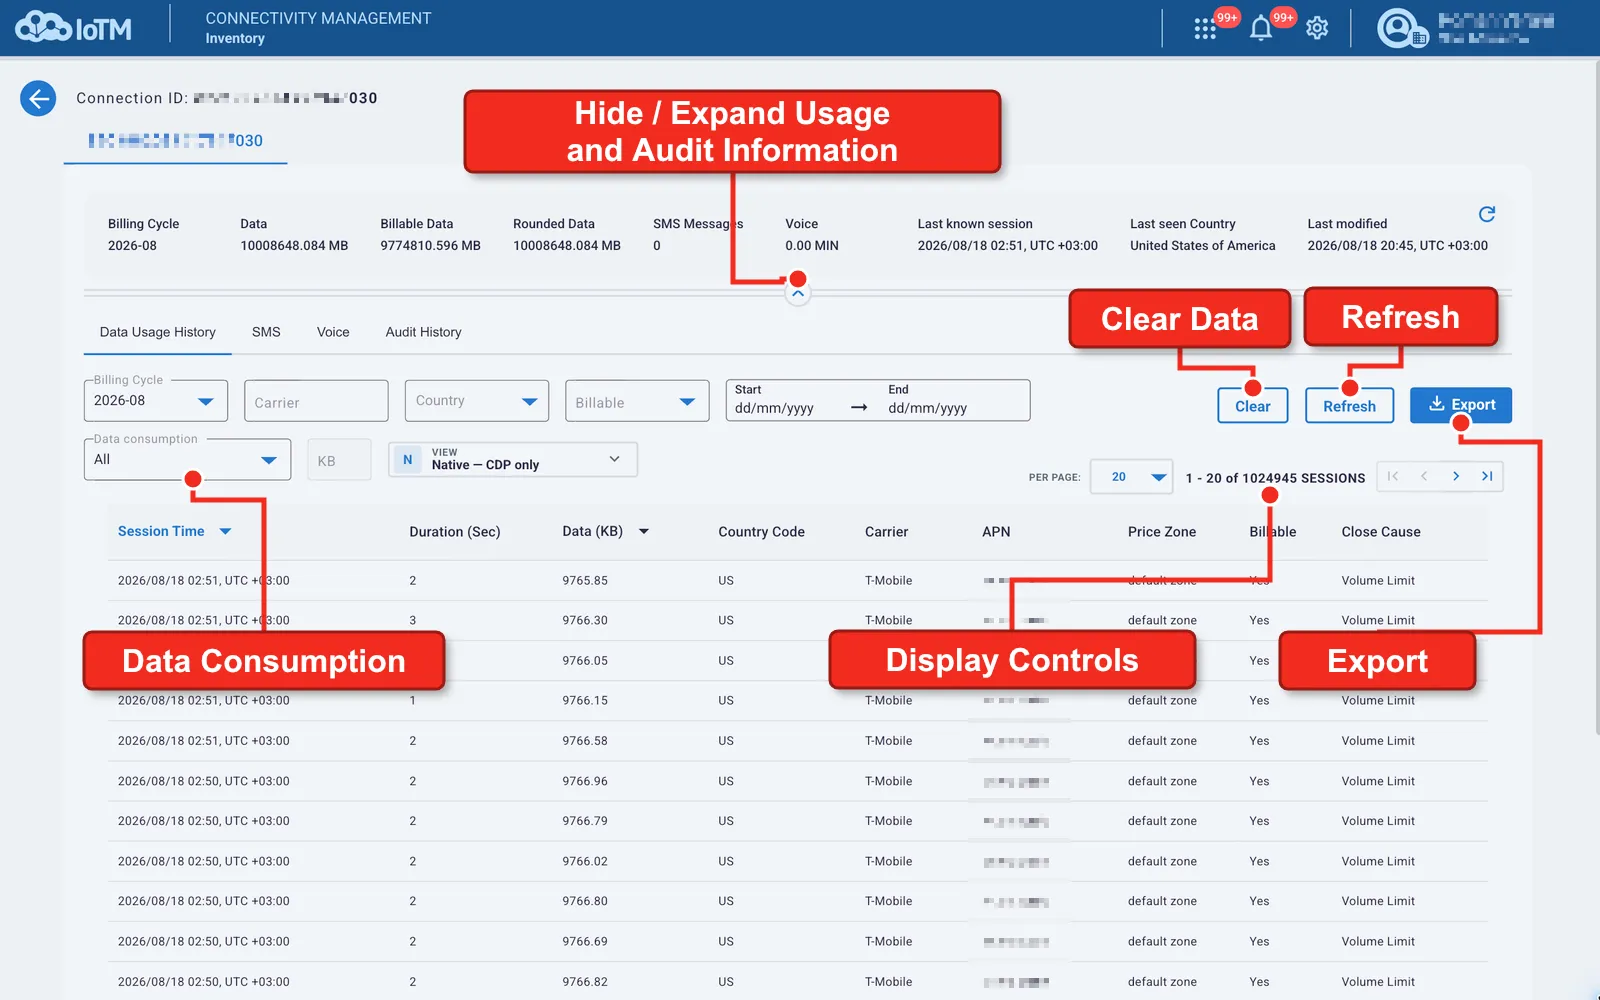
By default, you will find yourself on the Data Usage History tab. This expanded page features a grid view similar to that in the Inventory, only instead of connections, each row here represents a single connection’s recorded data, SMS, or voice session. The tabs for all three types of usage share a similar set of filters and control buttons, but some are unique to data, SMS or voice.
Control descriptions
Interface Control | Description |
|---|---|
Data Consumption / Number of Msg / Number of Seconds | Opens a dropdown menu allowing you to filter sessions by the amount of data consumed (in KB) by choosing between “Smaller Than”, “Larger Than”, and “All”, and providing a value in the input field next to it. In the SMS or Voice tab, the same interface element allows you to filter by the number of messages and the duration (in seconds), respectively. |
Billing Cycle | Opens a dropdown menu allowing you to filter by, and view sessions for the billing cycle of interest. If you need more granular control over the date span, you can use the “Calendar Filter” to specify the billing cycle. |
Carrier | Allows you to filter by carrier to which the connection had been assigned to in case there was more than one. |
Country | Allows you to filter the sessions by country. |
Billable Status | Opens a dropdown menu allowing you to filter by the session’s billable status. Choose between “Yes”, “No”, and “All”. |
Calendar Filter | Allows you to specify a start and an end date if you want to confine your search to a specific time period inside the billing cycle. |
From/To filter | This filter, available in the SMS and Voice tabs, allows the user to restrict the search by “Sent From” and “Sent To” numbers of the session. |
MO/MT filter | This filter, available in the SMS and Voice tabs, allows the user to restrict the search to MO or MT (“Mobile Originated”/” Mobile Terminated”) sessions only. Choose between “MO”, “MT”, and “All”. |
Clear Data button | This will clear the filter settings and default the displayed sessions to the current billing cycle. |
Export button | Click this button to export the list of sessions associated with your current selection, either as a Microsoft Excel © file or a CSV. |
Refresh button | This will refresh the data displayed for your selection. Click it after applying the desired filters to refresh your data. |
Display Control buttons | These controls allow you to change the number of items displayed on a page and browse through pages. |
The following information columns are displayed for each session in Connection Usage information under the Data tab. Note that not all information items are available in every CDP type:
- Session Time
- Duration (in seconds)
- Data (in KB)
- Country Code
- Carrier
- APN (Access Point Name)
- Price Zone
- Billable
- Close Cause
Under the SMS tab, the following columns are displayed:
- Sent Time
- Dir.
- Sent From
- Sent To
- Country Code
- Carrier
- Price Zone
- MT Count
- MO Count
- Billable
Finally, these are the columns found under the Voice tab:
- Sent Time
- Dir.
- Duration (in seconds)
- From
- To
- Country Code
- Carrier
- Price Zone
- Rate Plan
- MT Count
- MO Count
- Billable
10.9.1. Accessing the Diagnostics Wizard
Users with appropriate role-based privileges can launch the Diagnostics Wizard in any of the following ways:
- Diagnostics action button on the connection’s inventory grid line.
- RUN DIAGNOSTICS button on the single connection ID page.
10.9.1.1. Running Diagnostics from the Controls Area on the Device List Grid
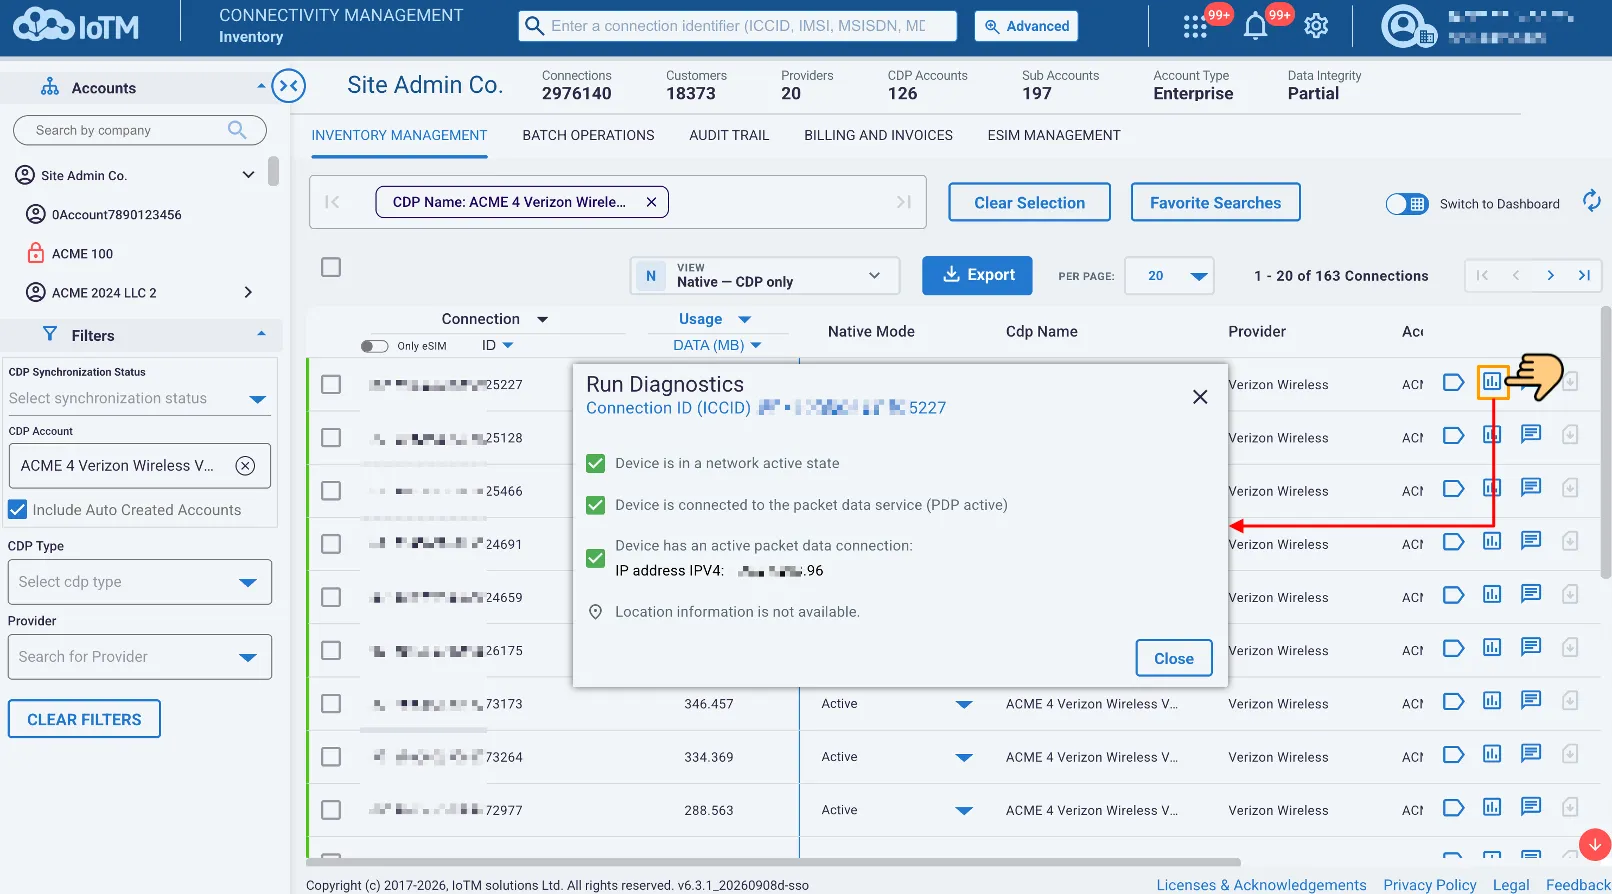
First step: Click on the diagnostic icon in the Controls Area of the grid (second icon from the left).
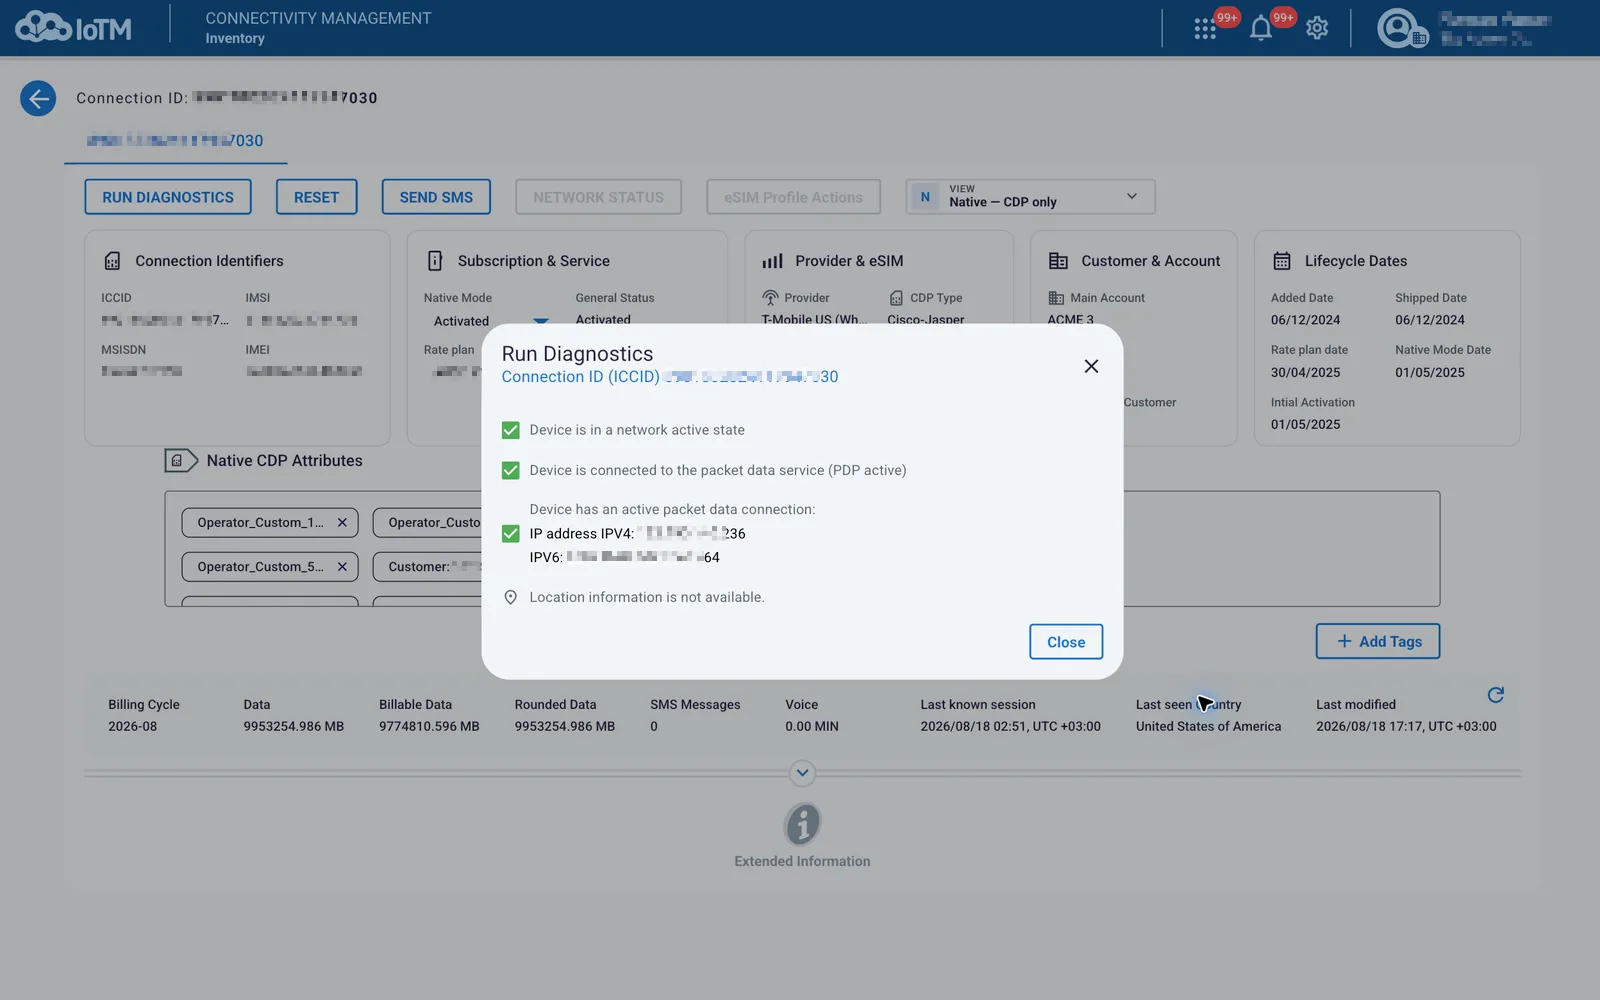
Second step: (Optional) After viewing the results, you may choose to reset and rerun the diagnostics on the connection.
10.9.1.2. Running Diagnostics from the Details Page
First step: Go to a connection’s Details Page by clicking on the connection row in the grid.
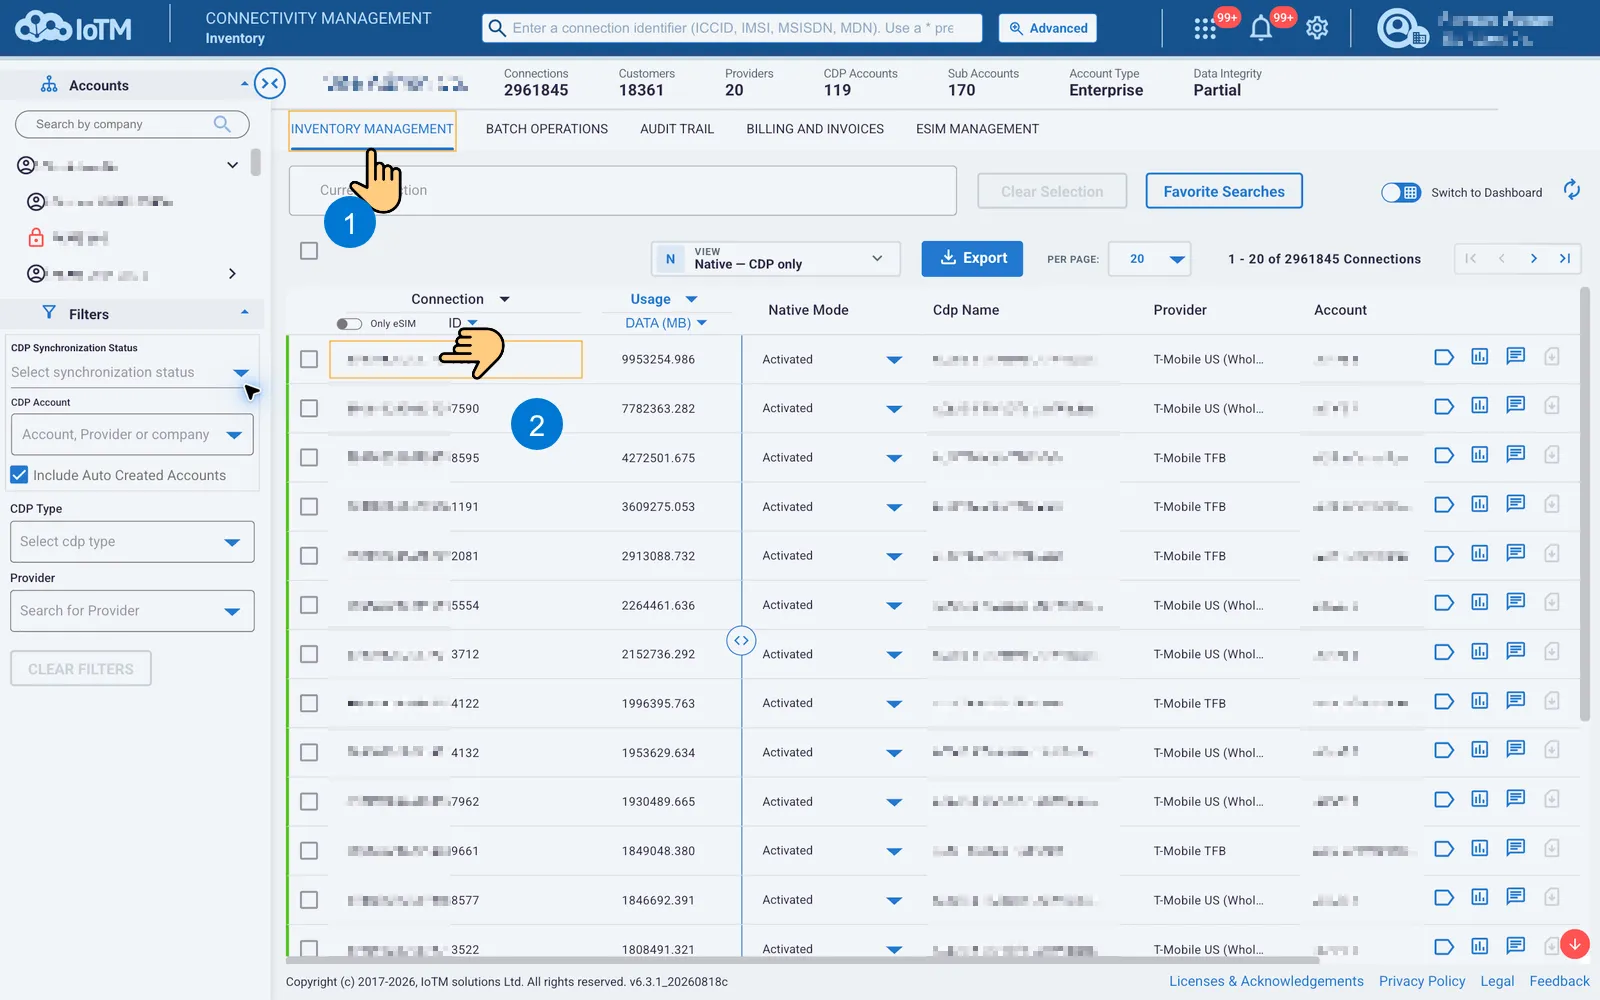
Second step: Click on the Run Diagnostics button in the upper-left area of the details pane.
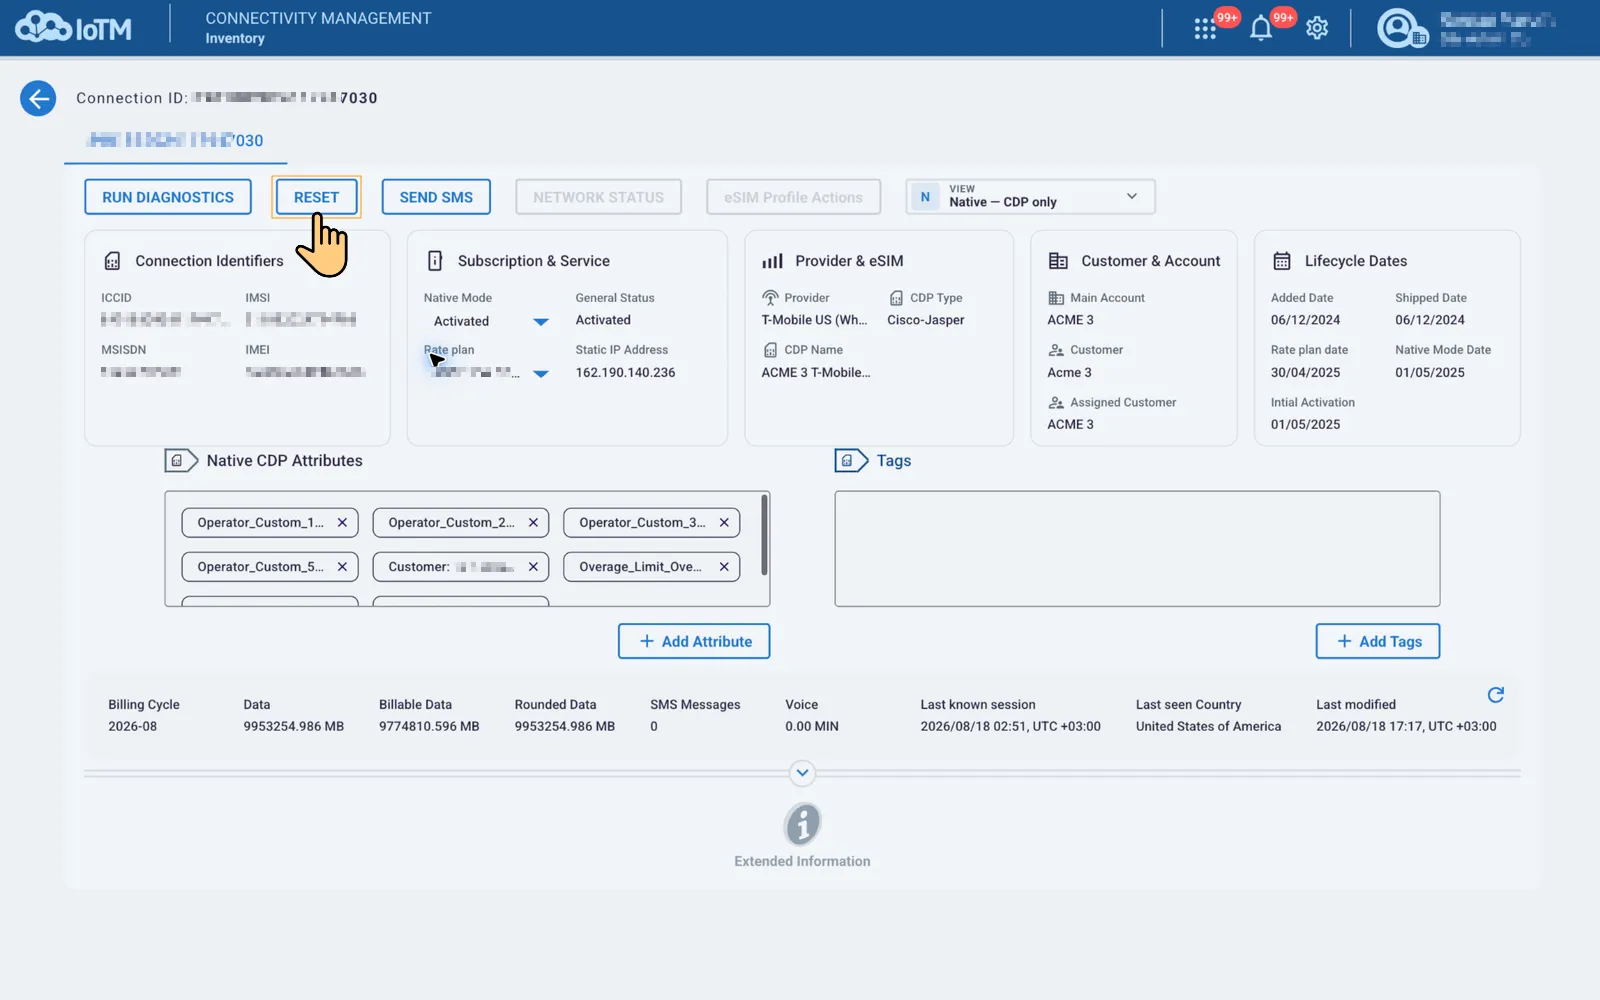
Third step: After viewing the results, you may choose to reset and rerun the diagnostics on the connection. You can also execute the reset as a separate action via a button in the same area in the Details Page.